Introduction
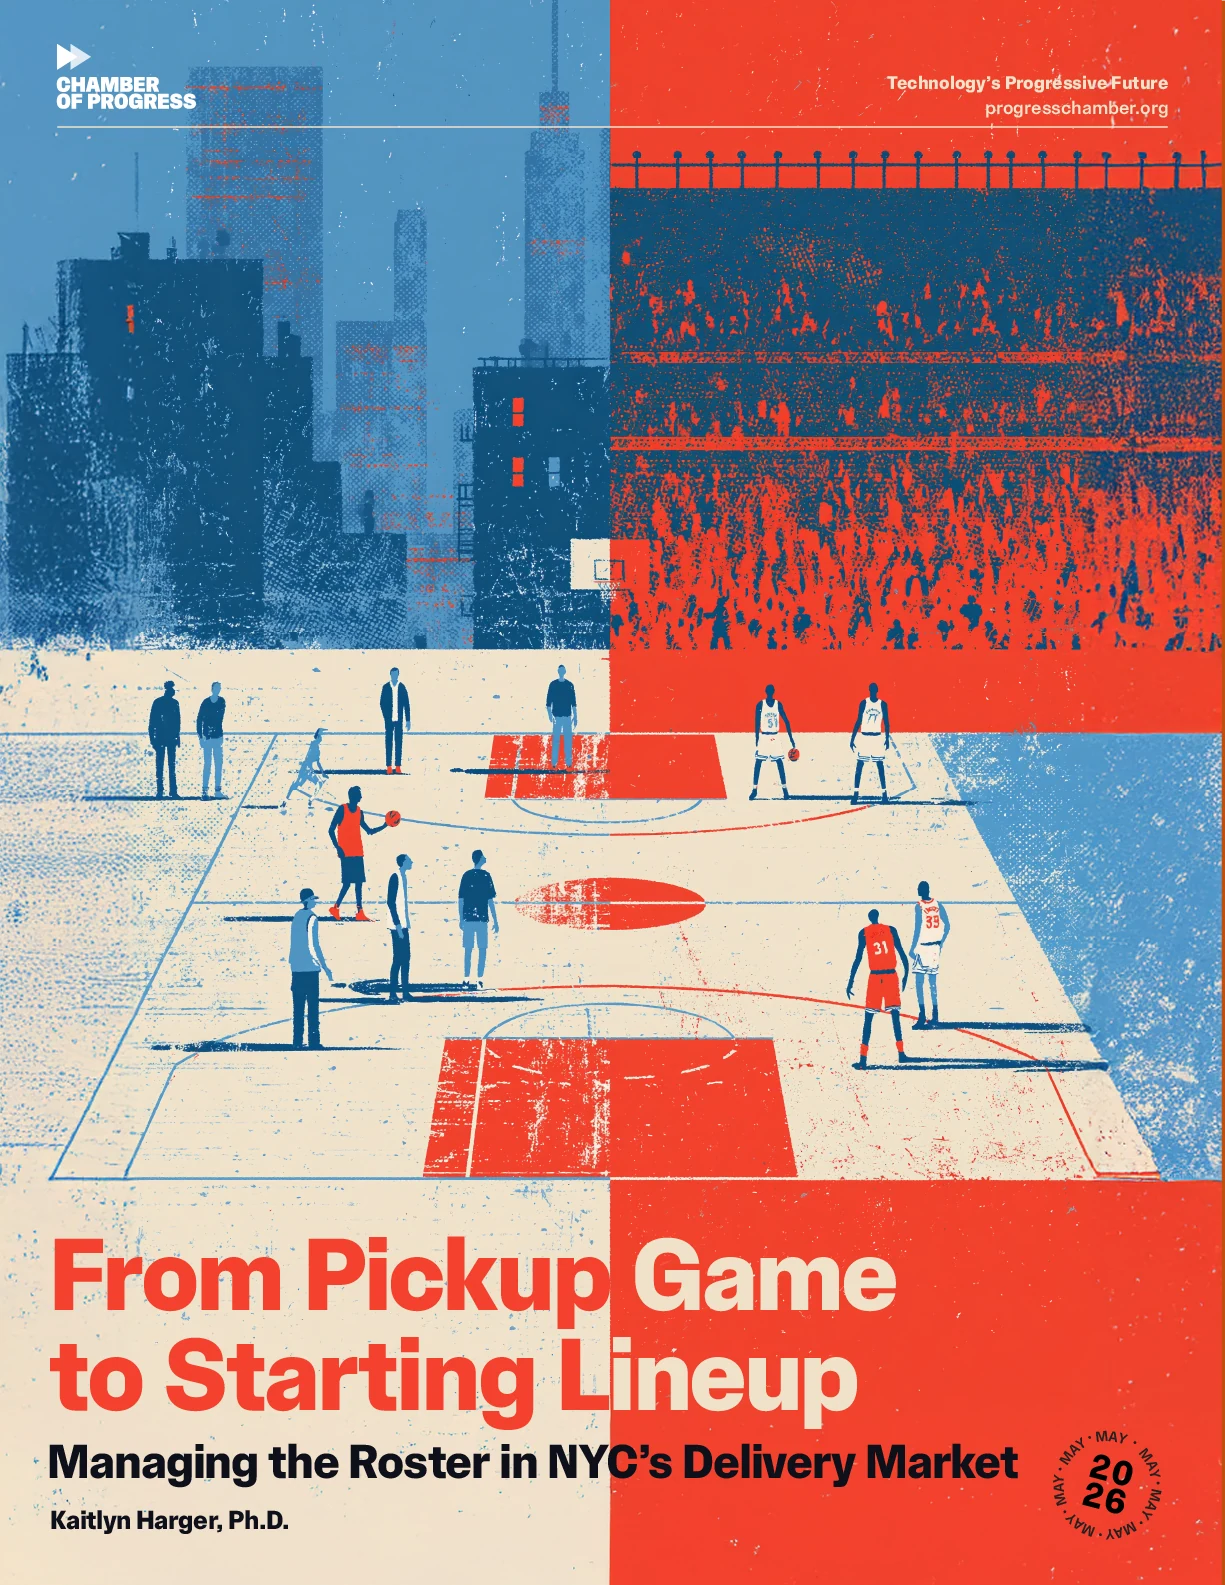
New York City restaurant delivery work has undergone a fundamental shift due to the city’s regulations. What once resembled an open pickup game, with easy access and flexible hours, now looks more like a managed starting lineup, with fewer workers, higher pay, and stricter conditions for staying on the floor.
The city didn’t just add rules. It repeatedly reshaped the labor market itself, influencing the size and structure of the workforce. At some points participation expanded; at others it contracted. The net result has been a smaller, more intensive workforce, not because regulation failed, but because regulation had structural consequences that went well beyond the wage increases that dominated the public conversation.
Before the regulations, virtually anyone could participate in restaurant delivery work. Entry and exit were easy. Workers could log on whenever they wanted and pick which deliveries to accept. Pay was variable, but the system offered real flexibility.1
Today the picture looks different. Due to the city’s rules, fewer restaurant delivery workers remain active at any given time, but those who do tend to work more hours and complete more deliveries. Earnings are higher and more predictable, but participation has become selective and entry opportunities are limited.
This is not a story of collapse. It’s a story of selection. Higher pay for some workers emerged alongside reduced access for others, as platforms concentrated deliveries among a smaller core workforce. The city set out to raise pay for food delivery workers, and it succeeded. But one consequence of the regulations has been more limited access to opportunities for workers who valued the flexibility of the old system.2
Access to the platforms is no longer fully open. After the minimum pay standard took effect, platforms introduced systems to manage when workers can log in and receive orders. They began capping the number of couriers who could be active at the same time. Data from the city show that total workers declined by over 42,000 workers.3 At one point, Uber Eats reported more than 27,000 workers on its waitlist for New York City alone.4 5
Understanding these dynamics is essential before policymakers layer on additional rules or try to export the NYC model to other cities. The regulation that already exists, the changes it produced, and the tradeoffs it created should be the starting point for any serious policy conversation.
The Regulatory Landscape: Far From the Wild West
New York City’s delivery market is not unregulated. Since 2020, the New York City Council and the Department of Consumer and Worker Protection have enacted more than a dozen laws and agency rules affecting third-party food delivery platforms. These span pay standards, platform conduct, consumer pricing, safety requirements, and data reporting. Together, they constitute a comprehensive regulatory framework, not a gap waiting to be filled.
| Year | Law / Rule | Policy Area | Key Provisions |
|---|---|---|---|
| Phase 1: Restaurant Platform Regulation | |||
| 2020 | Local Law 51 | Restaurant protections | Temporary cap on per-order fees platforms charge restaurants (15%)6 |
| 2020 | Local Law 52 | Restaurant protections | Temporary cap on total fees platforms charge restaurants (20%)7 |
| 2020 | Local Law 87 | Consumer protections | Requires platforms to disclose telephone charges to consumers8 |
| 2020 | Local Law 88 | Restaurant protections | Prohibits platforms from listing restaurants without consent9 |
| 2021 | Local Law 100 | Platform regulation | Makes restaurant fee caps permanent10 |
| 2021 | Local Law 101 | Platform regulation | Requires delivery app licensing with DCWP11 |
| 2021 | Local Law 102 | Consumer protections | Requires platforms to share customer data with restaurants12 |
| 2021 | Local Law 103 | Consumer protections | Prohibits charging restaurants for phone orders that don’t result in a sale13 |
| Phase 2: Worker Transparency and Protections | |||
| 2021 | Local Law 113 | Worker protections | Requires tip disclosure before workers accept deliveries14 |
| 2021 | Local Law 114 | Worker transparency | Requires delivery distance and estimated pay before acceptance15 |
| 2021 | Local Law 115 | Wage regulation | Directs DCWP to study worker pay and establish minimum pay standard16 |
| 2021 | Local Law 116 | Worker protections | Requires platforms to provide insulated bags at no cost17 |
| 2021 | Local Law 118 | Enforcement | Establishes civil penalties for platform violations18 |
| Phase 3: Wage Regulation and Expansion | |||
| 2023 | DCWP Final Rule | Wage policy | Minimum pay standard phased in starting July 202319 |
| 2025 | DCWP rate update | Wage policy | Full minimum rate reaches $21.44/hr (excluding tips) as of April 202520 |
| 2026 | Council bills | Worker protections | Deactivation protections; due process for account termination21 |
| 2026 | DCWP expansion | Wage policy | Minimum pay standard extended to grocery delivery workers22 |
Pay and labor standards. The biggest intervention was Local Law 115 of 2021, which authorized DCWP to set a minimum pay rate for app-based restaurant delivery workers.23 DCWP’s final rule, enforced starting December 2023, created a citywide minimum compensation standard tied to time spent completing deliveries.24 As of April 2025, the rate reached $21.44 per hour excluding tips, with annual inflationary increases.25 26
Platform conduct and transparency. The 2021 legislative package also introduced requirements for how platforms communicate with workers, including rules on pay disclosure, tip transparency, and prohibitions on retaliation and unjustified deactivation.27
Consumer pricing and restaurant fee limits. In 2020, the city imposed caps on commissions platforms could charge restaurants. Originally temporary pandemic relief, elements of these caps were later made permanent.
Safety, equipment, and data reporting. The city required platforms to provide insulated delivery bags at no cost and adopted consumer protection provisions. DCWP rules established in 2023 require platforms to submit quarterly operational data, which is the same data that forms the empirical basis for this paper.28
Taken individually, each law addressed a specific concern. Taken together, they form a comprehensive regulatory framework covering wages, pricing, transparency, safety, and platform practices.
A Note on Data Limitations
Before getting into the labor market effects, it’s important to be upfront about what the data can and cannot tell us.
The primary source for this paper is DCWP’s quarterly aggregated tables, compiled from operational data that six restaurant delivery apps (DoorDash, Grubhub, Uber Eats, Relay, FanTuan, and HungryPanda) are required to submit. This is the best available administrative data on the NYC delivery market.29
The data do not adjust for “multi-apping,” meaning workers who deliver for more than one platform at the same time. A courier active on both DoorDash and Uber Eats in a given week gets counted as two workers. An hour logged into two apps counts as two hours. DCWP’s own documentation notes that this means “the true average hourly earnings, average hourly pay, and average hourly tips are higher than the values presented.”30
This matters for interpreting the workforce numbers. If platforms consolidated and workers dropped a second app after the pay standard made a single app more viable, some of the measured decline in “total workers” reflects workers leaving a second platform, not leaving the market entirely. The overall direction of the story (fewer workers, higher productivity, higher pay) is supported across multiple sources, but the precise magnitudes should be treated as estimates rather than exact headcounts.
It’s also worth noting that the changes documented here occurred during a period of broader shifts in the labor market. Post-pandemic normalization, immigration enforcement changes, and general tightening in low-wage labor markets all may have contributed to workforce changes in the delivery sector. This paper does not claim that every change was caused solely by the minimum pay standard. The evidence suggests the pay standard was a significant driver, consistent with economic theory and with parallel experiences in Seattle, but other factors were likely at work too.31 32
How Policy Reshaped the Market
The regulations did not just set a wage floor. They changed the structure of how workers participate in the delivery economy.
In the early phase (2020 to 2022), several reforms focused on transparency. Platforms had to disclose how pay was calculated and how tips were handled. Those changes likely made it easier for new workers entering the market. In effect, the bench got deeper.33
The minimum pay standard, phased in starting July 2023, was the real turning point. By creating a binding compensation floor tied to delivery time, the policy increased the cost of active labor for platforms. Basic economics predicts what happens next: when wages are fixed above the prior market rate, firms adjust along other margins. They reduce total labor hours, increase productivity per worker, tighten scheduling, or limit entry.34
The administrative data from New York City are consistent with all of those adjustments. After the pay standard took effect, the active workforce contracted while productivity and earnings per worker went up.
The Labor Market Effects
The minimum pay standard reshaped nearly every dimension of how the delivery market operates. Comparing pre-regulation averages (Q1 2022 through Q3 2023) with post-regulation averages (Q1 2024 through Q2 2025):


Earnings per hour jumped 86 percent. Base pay jumped 219 percent. Productivity rose 58 percent. On-call hours, the time workers spend logged in and waiting for an order, dropped by two-thirds. Consumer fees rose 55 percent, the most visible cost. The headline is that wages went up and efficiency went up.
The workforce contracted, then partially recovered. The number of workers performing trips fell from about 87,000 in Q1 2022 to a low of roughly 59,000 in Q3 2024. Additionally, total workers declined by over 42,000 between Q1 2022 and Q2 2025.
Idle time collapsed. On-call hours fell 66 percent, from 768,000 in Q1 2022 to 260,000 in Q2 2025. This is the clearest signal that platforms fundamentally restructured how they allocate work. Workers are spending much more of their logged-in time actually delivering.
Earnings per hour increased. Total earnings per hour went from $13.40 in Q1 2022 to $24.03 in Q2 2025. For workers who remain active on the platforms, this is a meaningful improvement.35
Where pay comes from changed completely. Before the pay standard, tips made up nearly half of hourly earnings (average tip per hour of $6.32 in Q1 2022). By Q2 2025, tips had fallen to $2.99 per hour, or about 12 percent of total earnings. Base pay surged from $7.08 to $21.04. The chart below shows the shift.36
Recent public debate over platform tipping practices has drawn significant attention, but the data suggest this conversation may be somewhat misplaced. Tips now represent roughly 12 percent of total hourly earnings for delivery workers, down from nearly half before the pay standard took effect.

Policymakers and advocates focused on tipping transparency may be anchored to a period when tips were the primary lever for worker compensation. That is no longer the case. The minimum pay standard effectively shifted the foundation of delivery worker earnings from variable, consumer-dependent tips to guaranteed, platform-paid base compensation. Any policy intervention aimed at tipping should be weighed against this new baseline, not the pre-regulation one.
Growth in Order Volume
In addition to reshaping the labor market, the minimum pay standard coincided with continued growth in consumer demand. The delivery market did not shrink. By most measures, it expanded.
Total deliveries grew from 2.51 million in Q1 2022 to 3.27 million in Q2 2025, a 30 percent increase. This is the cleanest measure of market growth because it reflects actual order volume rather than dollar amounts, and requires no adjustment for inflation.

Total order subtotals tell a similar story. In nominal terms, restaurant order subtotals grew from $65.7 million in Q1 2022 to $98.3 million in Q2 2025, an increase of 50 percent. But nominal spending growth can be misleading. Restaurant prices rose significantly over this period, and some portion of that growth simply reflects higher menu prices rather than increased economic activity.
Adjusting order subtotals using the BLS Consumer Price Index for Food Away from Home, cumulative food-away-from-home inflation over this period was approximately 19 percent. After adjusting for this, real order subtotals still grew 26 percent, from $65.7 million to $82.6 million in Q1 2022 dollars.37

The average order subtotal adds an important nuance. In nominal terms, the average subtotal per delivery rose from $26.21 to $30.06, a 15 percent increase. But after adjusting for restaurant inflation, the real average subtotal actually declined slightly, falling about 4 percent to $25.26 in Q1 2022 dollars.

This pattern is revealing. Total real spending grew 26 percent while real spending per order declined slightly. The number of orders increased substantially: a 30 percent increase in total deliveries. The growth in the delivery market was driven by volume, not by consumers spending more per order. More people placed more orders, but each order was worth slightly less in real terms.
The data do not include unique customer counts, so it is not possible to say definitively whether this reflects new customers entering the market, existing customers ordering more frequently, or some combination of the two. But the pattern is consistent with market expansion.
The market absorbed the cost increases through a combination of higher consumer fees, improved operational efficiency, and continued demand growth. The delivery economy did not contract; it restructured.
What’s Currently Working
The city’s framing is that the minimum pay standard has returned more income to delivery workers since it took effect. Earnings roughly doubled. Order volumes are up. Consumer spending hit record highs. The delivery market is growing, not shrinking.38
A labor advocate could look at the same data and reasonably conclude that since the city stepped in, workers now make $24 per hour. The workforce is smaller, but the old market was oversaturated with workers competing. For workers still active on the platforms, the policy has been a clear improvement.
But it leaves important questions on the table. What happened to the workers who are no longer active? Were they pushed out by platform restrictions, or did they leave for better opportunities? Does a system where 27,000 workers sit on a waitlist represent a healthy labor market or a new kind of barrier? And does the shift from flexible, open-entry work to a managed system with restricted participation create costs that the headline numbers don’t capture?
Those questions matter especially for policymakers thinking about extending similar rules to other sectors or cities.
Who Benefits and Who Faces Reduced Access
This is not a story of collapse. It is a story of selection. The same mechanism that raised earnings for some workers also shrank the pool of people who could participate.
The Gains: High-Volume Workers
High-volume workers who remained active after the pay standard saw real improvements. Baseline hourly pay roughly tripled, from $7.08 to $21.04 before tips between Q1 2022 and Q2 2025. The share of time spent actually delivering (rather than waiting for orders) rose 56 percent.39 Deliveries per worker per hour increased 58 percent over the same time period.40
The new system rewards workers who can commit to consistent, high-hour engagement. The people who benefit most are the ones who function more like full-time employees than casual participants.
The Costs: Reduced Access for Others
At the same time, participation got more restricted. When labor costs rise under a binding wage floor, firms have incentives to cut excess supply and minimize idle time.41
In practice, platforms responded by limiting simultaneous log-ins, tightening scheduling, and concentrating orders among a core group of workers.42
The workers most likely to face reduced access are part-time workers who relied on intermittent access, people seeking supplemental rather than primary income, and workers who valued the ability to log on and off with minimal friction. For them, the value of platform work was always less about consistent high earnings and more about flexibility. And flexibility is exactly what a managed-roster system constrains.
The regulations effectively created a two-tier system: insiders who secured a spot and earn well, and outsiders who can no longer access the market at all.
A Note on Gender
Some evidence suggests that a less flexible system could have gender-skewed effects. DoorDash has reported that a majority of Dashers identify as women, and broader research on gig work finds that women frequently cite schedule flexibility and supplemental income as primary motivations for platform participation.43 44
World Bank research on global gig work finds a similar pattern: women participate in online gig work at higher rates than in the general labor market and are more likely to use it as supplemental income.45
If the workers most affected by reduced access are the ones who used delivery work for flexible, part-time income, and if women are overrepresented in that group, then the move toward a managed roster could disproportionately affect women’s access to platform work.
What Consumers Are Paying
When regulations raise the cost of providing a service, firms pass some of those costs along. The delivery sector is no exception.
Platforms were upfront about it. In court filings, Uber said that fully passing on higher minimum payments “would cause average consumer fees to more than double from current levels.” When the rules expanded to grocery delivery in January 2026, Instacart imposed a $5.99 per-order regulatory fee, substantially higher than the restaurant delivery surcharges.46 47

So far, the market has absorbed these increases. Consumer spending hit record highs and order volumes kept growing. The average total order cost went from $37 to about $41 over this period. For a family ordering delivery twice a week, that’s roughly $416 more per year.48
But the fee trajectory is worth watching, particularly as grocery delivery expansion adds more cost pressure. And the question of how fee increases affect lower-income consumers, who tend to be more price-sensitive, remains open.49
Productivity improvements appear to have helped platforms absorb some of the higher labor costs without relying entirely on fee hikes. By concentrating deliveries among fewer workers and cutting idle time, platforms improved operational efficiency. Higher guaranteed pay was funded partly by fees and partly by doing more with less.
What Seattle Tells Us
New York isn’t the only city that tried this. Seattle’s App-Based Worker Minimum Payment Ordinance took effect in January 2024, offering a useful comparison.50
A recent NBER working paper found that Seattle’s law immediately doubled average base pay per task, from $5.37 to $12.52. But tips fell sharply, offsetting over a third of the gain. Available tasks dropped at least 20 percent within three months. And yet, monthly driver earnings showed no significant long-term increase.
The structural dynamics look similar to New York: a pay standard led to reduced worker access, tip offsets, and platform restructuring. But the outcomes diverged. In NYC, total earnings per hour nearly doubled and stayed elevated. In Seattle, the gains essentially washed out.
Why the difference? A few factors probably matter. New York’s market is much larger and more order-dense, giving platforms more room to improve routing efficiency. New York phased in the standard gradually; Seattle’s hit all at once. And New York’s rule was built on a multi-year rulemaking process with extensive stakeholder input, which may have produced a better-calibrated standard.
The lesson for policymakers isn’t that minimum pay standards always fail or always succeed. It’s that these policies produce complex structural effects that depend heavily on market conditions and implementation design. Cities considering similar rules should look closely at both New York and Seattle, and be realistic about the tradeoffs.
What the Parrott Study Gets Right and What It Leaves Out
James Parrott, a consultant for the DCWP on the minimum pay standard, produced an analysis of the delivery pay standard that is one of the earliest detailed looks at how the policy played out.51
The Parrott study documents outcomes that are consistent with the data in this paper: earnings per delivery went up substantially, overall weekly earnings for active workers rose, and the number of workers completing deliveries declined.
However, Parrott presents the reduction in active workers largely as a secondary outcome. In reality, it was the central mechanism through which higher per-worker earnings were achieved.
Before the pay standard, platforms maintained large pools of available workers. Couriers could log on intermittently and pick up a few deliveries even if they only worked a handful of hours. Under the current system, platforms have strong incentives to limit how many workers are active at any given time and to funnel orders to the ones who remain consistently available.
The total volume of delivery work did not expand dramatically. But the number of workers sharing that work went down. The result is a system where fewer people each get a bigger piece, and everyone else is locked out.
That does not erase the pay gains. But it means the same mechanism that raised earnings for some workers also shrank the pool of people who can participate.
That’s a tradeoff worth taking seriously.
Conclusion: Already Regulated, Still Evolving
Policymakers should consider three realities:
- 01First, New York City’s restaurant delivery sector is not the wild west. It is governed by a dense, layered framework of laws and agency rules covering pay, pricing, transparency, safety, and data reporting. Policymakers considering additional interventions should start from the accurate premise that substantial regulation already exists.
- 02Second, that regulation produced real effects. Hourly earnings for active workers increased roughly 80 percent. Delivery demand stayed strong. But the regulations also restructured the market: the workforce contracted, access got more restricted, idle time collapsed, and work concentrated among fewer, more productive couriers. These are not unintended side effects. They are the predictable consequences of imposing a binding wage floor in a flexible labor market.
- 03Third, tradeoffs matter. The shift from open access to a managed roster changes who can participate in the delivery economy and on what terms. For workers who secured a spot on the starting lineup, the policy is a clear win. For those on the outside, the market has become harder to reach.
Before further changes are made to the city’s rules, the city should take stock of what its existing regulations have already accomplished, and what they have already cost. The delivery sector does not need more rules. It needs time for policymakers, platforms, and workers to understand the rules that are already in place.